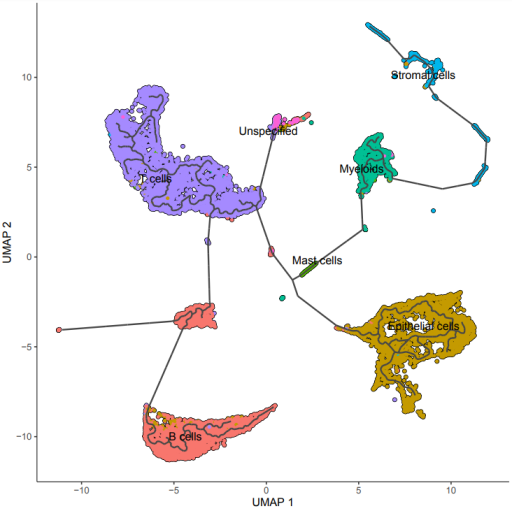
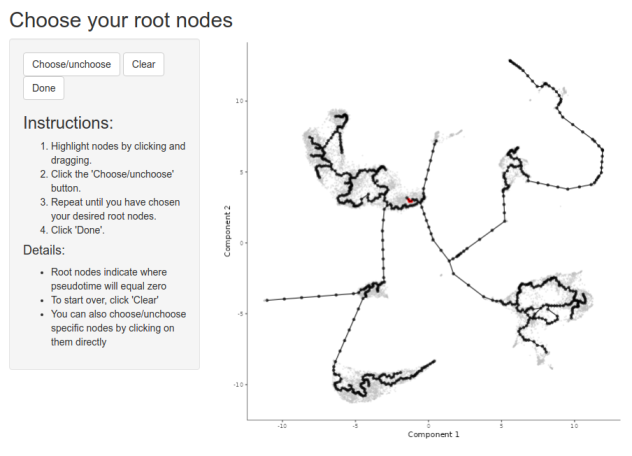
learn_graph(cds)绘制plot_cells(cds, color_cells_by = "cell.type")正常,
但在在order_cell(cds)命令选择自定义节点后,运行plot_cells(cds,color_cells_by="pseudotime)后报错:


Error in value[[3L]](cond) :
No pseudotime for UMAP calculated. Please run order_cells with reduction_method = UMAP before attempting to color by pseudotime.
服务器和本地R上都尝试了,但报错结果相同。希望路过的朋友指点一下。
以下是完整代码,在最后一步绘图报错,
文中cds.rds数据链接: https://pan.baidu.com/s/12JTZYiWOFPc95MIE3WSwNg?pwd=e5wb
################################# Information ##################################
# Single Cell Analysis (processed matrix)
#
#
# Log:  2023-9-25 start writing;
#       2023-9- accomplish version 1.0;
#       2023-9-25 last update.
#
# Data: https://www.ncbi.nlm.nih.gov/geo/query/acc.cgi?acc=GSE132257
# Ref:  https://www.nature.com/articles/s41588-020-0636-z
#       https://cole-trapnell-lab.github.io/monocle3/
################################################################################

#### Lib Packages ####
library(Seurat)
library(monocle3)
library(ggplot2)
library(dplyr)

#### set work path ####
rm(list = ls())
setwd("~/Code/RCode/SingleCell/RefDemo/Demo2/GSE132257/")

#################################### START #####################################
library(monocle3)
library(Seurat)

#### 1) Input data #############################################################
filepath1 <- "seurat.rds"

seurat <- readRDS(filepath1)

data <- GetAssayData(seurat, assay = "RNA", slot = "counts")
Cell_metadata <- seurat@meta.data
Gene_annotation <- data.frame(gene_short_name = rownames(data), row.names = row.names(data))

cds <- new_cell_data_set(data,
                         cell_metadata = Cell_metadata,
                         gene_metadata = Gene_annotation)

#### 2) Process data ###########################################################
# normalize,  calculate dimension
cds <- preprocess_cds(cds, method = "PCA", num_dim = 100,
                      scaling = TRUE)

dev.new()
plot_pc_variance_explained(cds)
dev.off()

# Reduce the dimensions using UMAP
cds <- reduce_dimension(cds, reduction_method = "UMAP",
                        umap.fast_sgd = T, cores = 5)


dev.new()
plot_cells(cds, color_cells_by = "seurat_clusters")
dev.off()

dev.new()
plot_cells(cds, reduction_method = "UMAP", color_cells_by = "cell.type")
plot_cells(cds, reduction_method = "UMAP", color_cells_by = "orig.ident")
dev.off()

# Remove batch effects
cds <- align_cds(cds, alignment_group = "orig.ident", num_dim = 100)

cds <- reduce_dimension(cds, reduction_method = "UMAP",
                        umap.fast_sgd = T, cores = 5)
# cluster
cds <- cluster_cells(cds, resolution = 1e-5)

dev.new()
plot_cells(cds, reduction_method = "UMAP", color_cells_by = "cell.type")
plot_cells(cds, reduction_method = "UMAP", color_cells_by = "orig.ident")
dev.off()

#### 3) Trajectory in pseudotime ###############################################
cds <- learn_graph(cds)

dev.new()
plot_cells(cds,
           color_cells_by = "cell.type",
           label_groups_by_cluster = FALSE,
           label_leaves = FALSE,
           label_branch_points = FALSE,
           group_label_size = 4,
           cell_size = 1.0)
dev.off()

order_cells(cds, reduction_method = "UMAP")

# 绘图报错!报错!报错!
dev.new()
plot_cells(cds,
           color_cells_by = "pseudotime",
           label_cell_groups=FALSE,
           label_leaves=FALSE,
           label_branch_points=FALSE,
           graph_label_size=1.5,
           group_label_size=4,
           cell_size=1.0)
dev.off()

#### Save cds ##################################################################
saveRDS(cds, file="cds.rds")

##################################### END ######################################
生信调酒师